
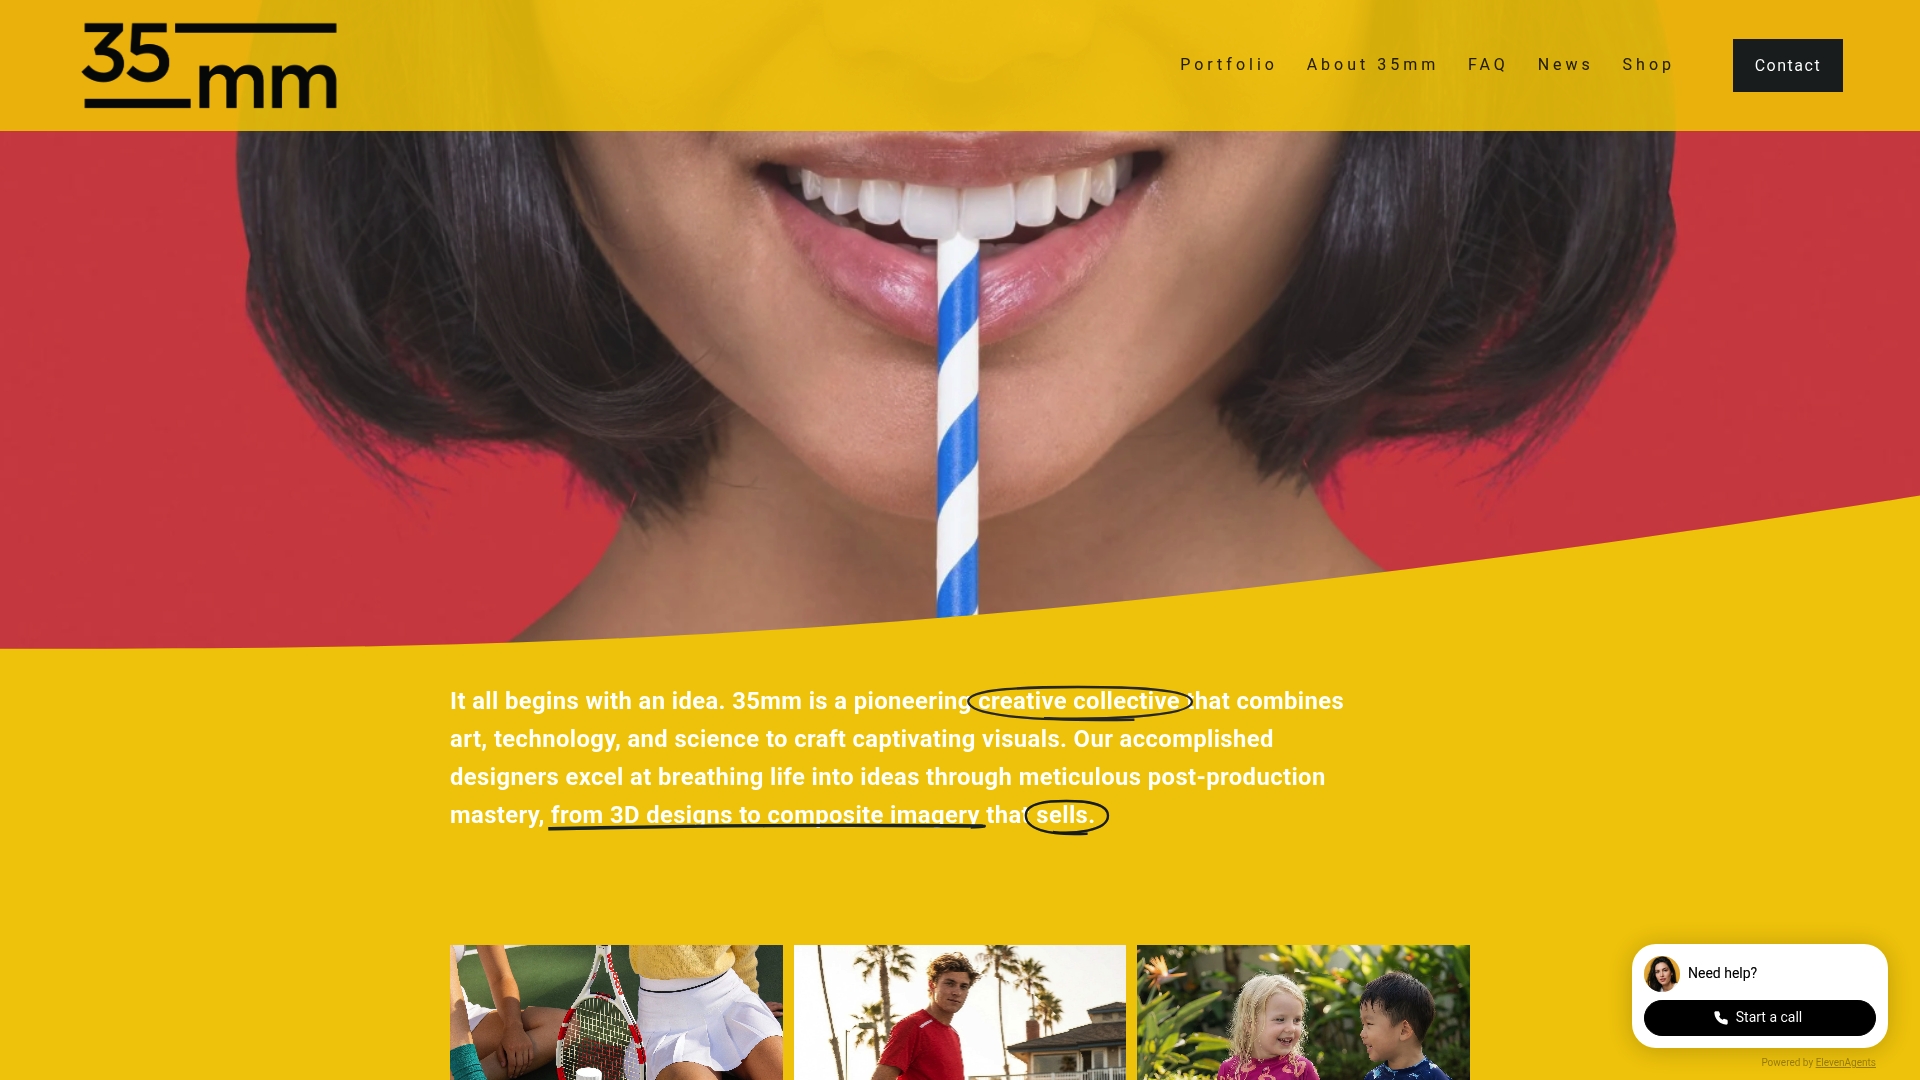
Tech and automotive brands face a relentless battle for attention. Every campaign competes against a wall of content, and the brands that cut through do so with a deliberate visual strategy. Visual content earns 94% more views than text-only alternatives, while short-form video now leads all formats in marketing ROI at 48.6%. These numbers are not accidental. They reflect brands that plan, execute, and measure their visuals with precision. This guide walks you through each step of that process, from goal-setting to performance analysis, so your team can build a visual content engine that drives real, measurable results.
Table of Contents
- Set clear objectives and know your audience
- Choose the right content types for each step
- Build and streamline your visual workflow
- Measure, adapt, and amplify
- Why agility and authenticity outperform one-size-fits-all strategies
- Bring your visual strategy to life with expert support
- Frequently asked questions
Key Takeaways
| Point | Details |
|---|---|
| Start with clear goals | Defining objectives and audience needs is the foundation of effective visual strategy. |
| Match visuals to the buyer’s journey | Choosing the right format at each stage amplifies engagement and trust. |
| Streamline creation with AI | AI tools accelerate production, but brand oversight keeps quality high. |
| Data-driven adaptation | Measuring and iterating your content strategy drives real business growth. |
| Prioritize authenticity | Authentic and responsive visuals outperform generic, templated designs. |
Set clear objectives and know your audience
Before a single frame is composed or a single render is rendered, your team needs absolute clarity on what success looks like. A visual content strategy is far more than a collection of pretty images. It involves defining your brand identity, mapping audience preferences, establishing content goals, selecting the right content types, building a publication calendar, and setting up a system to measure everything that happens after you publish. Skipping any one of those layers is the fastest way to produce visuals that look impressive in isolation but fail to move any meaningful business metric.
In technology and automotive marketing specifically, audiences are sophisticated. A product manager evaluating enterprise software and a car buyer researching their next purchase both respond to visuals, but they respond to very different ones. The enterprise buyer needs clarity, credibility, and proof. The automotive buyer wants aspiration, performance cues, and emotional resonance. Understanding these distinctions before you brief a creative team determines whether your visuals land or get scrolled past.
Start by anchoring every content initiative to a specific business outcome. Are you generating leads for a new product launch? Building brand awareness in a market where you are not yet known? Educating existing customers to reduce churn? Each of these objectives calls for a different visual approach, a different channel mix, and a different measurement framework. Grouping all of your visual output under one vague goal like "increase engagement" leaves too much room for unfocused work.
Once your objectives are locked, map your visuals to the buyer's journey. The consideration phase is where your audience compares options, which is where explainer videos and detailed infographics earn their keep. The awareness phase rewards fast, scroll-stopping content. Knowing where each piece fits prevents the common mistake of sending decision-stage content to cold audiences and awareness-stage content to buyers who are ready to act. You can also explore essential agency design assets that help structure this kind of strategic content mapping across a full campaign.
Pro Tip: Short-form video and motion graphics work best for top-of-funnel awareness, where you have under three seconds to earn attention. Reserve longer visual formats, like product demos, walkthroughs, and case-study imagery, for the middle and bottom of the funnel where your audience is actively evaluating.
Choose the right content types for each step
Now that your objectives and audience are in focus, selecting the right visual format at each buying stage becomes the operational priority. Not all visual content serves the same purpose, and using the wrong format at the wrong moment is one of the most common and costly mistakes in campaign planning. Mapping visuals to the buyer's journey, with short videos and infographics for awareness and demos or data charts for decision stages, is the framework that consistently produces results.
At the awareness stage, infographics, bold branded imagery, and short-form video clips create the first impression. These formats are engineered for speed. They need to communicate a core idea within seconds, before the audience moves on. For tech brands, this often means visualizing complex data in a single striking graphic. For automotive brands, it means photography or CGI that communicates the emotion of the vehicle before a single spec is mentioned.

During the consideration phase, the conversation shifts. Your audience is now comparing, researching, and weighing options. This is where explainer videos, annotated product images, and case-study visuals play a critical role. A well-produced explainer video that shows a software platform solving a real workflow problem is far more persuasive than a bullet list of features. Similarly, a side-by-side visual comparison of vehicle performance data tells a cleaner story than a paragraph of text. The connection between design's role in campaigns and measurable conversion lift is strongest at this stage.
At the decision stage, user-generated content, interactive demos, and highly specific product visuals close the gap between interest and action. Brands with strong visuals grow revenue 2.9x faster, video shortens sales cycles by 28%, and user-generated content increases conversions by 29%. These are not soft benefits. They directly impact pipeline velocity and revenue timing.
| Funnel stage | Best visual formats | Primary goal |
|---|---|---|
| Awareness | Short-form video, infographics, branded imagery | Capture attention |
| Consideration | Explainer videos, case-study visuals, comparison charts | Build understanding |
| Decision | Product demos, UGC, interactive visuals | Drive conversion |
Pro Tip: In B2B technology and automotive sectors, the decision stage often involves multiple stakeholders. Producing visual assets that work equally well in a sales presentation and a social feed gives your team more leverage per piece of content without doubling the production budget.
Build and streamline your visual workflow
Once content formats are chosen, seamless execution and streamlined systems become your edge. The most strategically sound visual plan collapses under its own weight if the production workflow is disorganized. We have seen teams with excellent creative instincts lose weeks to version control issues, inconsistent file naming, and approval bottlenecks that could have been resolved with a simple process design upfront.
Start with your asset library. A cloud-based digital asset management system gives everyone on your team, including external agencies and post-production partners, access to approved brand elements, reference files, and completed assets without the chaos of email chains and shared drives. This single investment pays dividends across every campaign you run because it eliminates the time lost searching for assets that already exist.
A content calendar is equally non-negotiable. Planned content gives you time for quality production. Reactive content demands speed. Your calendar should accommodate both, with a mix of evergreen visual assets that can be deployed on short notice and campaign-specific content that is scheduled well in advance. Building this structure around your product launch cycles and industry events creates a natural rhythm that the whole team can work within.
AI tools are transforming production speed across the industry. AI-powered production saves up to 40% of time in visual content workflows, but human oversight is still the critical check that keeps output aligned with your brand. At 35milimetre, we have integrated AI image generation into our retouching and compositing pipeline over the past year, not to replace judgment, but to accelerate iteration. AI handles the repetitive scaffolding so our team can spend more time on the creative decisions that actually differentiate a brand.
The following steps outline a workflow structure we recommend for technology and automotive marketing teams:
- Brief all creative requests through a standardized template that captures the objective, audience segment, funnel stage, and required formats.
- Store all approved brand assets in a single cloud-based library with clear naming conventions and access controls.
- Produce visual content in batches rather than one piece at a time to take advantage of setup efficiency.
- Build an internal review and approval stage with defined stakeholders and clear feedback deadlines.
- Publish according to the content calendar and document all performance data in a shared dashboard.
For a deeper look at how to structure this kind of operation, our guides on building a high-efficiency visual workflow and how a creative production company's workflow applies these principles in practice are worth studying.
Pro Tip: Standardized visual templates for recurring content types, like social cards, product comparison sheets, or event banners, can shave 30 to 40% off production time on repeat work. The key is building templates that are flexible enough to feel fresh each time without requiring a full redesign from scratch.
Measure, adapt, and amplify
To ensure your commitment to visuals translates into business value, you need robust measurement and rapid adaptation. A visual strategy without analytics is just art direction. The brands that consistently grow their market presence are the ones that treat every content decision as a testable hypothesis and every campaign as a source of learning.
The metrics worth tracking depend on your objective. Awareness campaigns should be judged on reach, impressions, and view-through rates. Consideration-stage content earns its place by driving time-on-site, content shares, and return visits. Decision-stage visuals live or die by conversion rates, form completions, and influenced revenue. Conflating these metrics, or applying one set of benchmarks across all funnel stages, produces misleading reads on performance.
"Consumer electronics brands that implemented systematic visual content strategies saw 3.8x higher engagement and a 27% revenue boost within a single campaign cycle." — QAInsta Visual Content Case Studies
That kind of result does not come from guessing. It comes from running structured comparisons across content formats, channels, and audience segments. Head-to-head testing, where you run the same campaign message as a static image versus a short video versus an interactive graphic, gives you clean data on what your specific audience responds to. Over time, those findings become a proprietary understanding of your market that no competitor can easily replicate.
Visual content earns 94% more views than text, and Facebook posts with images see engagement rates that are 650% higher. But averages are just starting points. Your job is to find what outperforms average for your brand, your audience, and your category. That requires consistent measurement, honest interpretation of the data, and the willingness to retire formats that underperform even when the team is emotionally attached to them.
| Content type | Engagement advantage | Revenue / conversion impact |
|---|---|---|
| Visual vs. text | 94% more views | Higher brand recall |
| Video in B2B | Shorter sales cycles | 28% faster close rate |
| UGC with visuals | Higher trust signals | 29% conversion lift |
| Systematic visual strategy | 3.8x engagement increase | 27% revenue boost |
Scaling what works is the final step. When a specific format outperforms consistently, allocate more production resources to it and adapt the winning approach across additional channels. Our article on innovative visual workflows covers how leading brands operationalize this kind of data-driven scaling without losing creative quality.
Why agility and authenticity outperform one-size-fits-all strategies
Here is the uncomfortable reality that most visual content guides avoid: following a template will make you average. Templates are useful for production efficiency, but if your visual strategy itself is templated, you will produce content that feels interchangeable with every other brand in your category. Tech and automotive audiences are particularly attuned to this. They see so much polished, high-budget content that generic visual language barely registers.
The brands we have worked with that achieve real, sustained growth share one trait. They develop a signature visual language rooted in their actual brand values and then apply that language flexibly across different formats and channels. This is different from simply maintaining brand guidelines. It means your content feels distinctively yours even when the format changes, even when the platform demands something new, even when a cultural moment calls for a rapid response.
Short-form video dominates ROI across most categories, but in B2B technology and automotive, long-form visual content builds a deeper, more durable kind of trust. A well-produced 12-minute product walkthrough that actually solves a problem for a qualified prospect is worth more than a hundred six-second clips that spike impressions but generate no qualified interest. The brands that understand this nuance invest in both, using short-form to reach new audiences and long-form to convert them.
Agility matters just as much as authenticity. Brands that test new formats early, learn from real audience behavior, and evolve their visual approach continuously outgrow those that wait for perfect production conditions. Imperfect content published at the right moment often outperforms flawless content published too late. We have seen this play out repeatedly in automotive launch cycles, where the brand willing to publish authentic, less polished content during a live event captures far more engagement than the brand still finalizing its glossy post-production. Combining this kind of responsiveness with strong brand storytelling best practices is where the biggest competitive advantages are built.
Bring your visual strategy to life with expert support
Strategy is only as valuable as the visuals it produces. If your team has the roadmap but lacks the production capacity to execute at the quality level your brand demands, the gap between plan and output can undermine even the best thinking.
At 35milimetre, we partner with marketing teams and ad agencies in the technology and automotive sectors to close exactly that gap. From high-end retouching and compositing to CGI product renders and AI-enhanced imagery, our visual post production experts bring over two decades of hands-on experience to every brief. We work as an extension of your team, scaling our capacity to match your project demands without the overhead of building in-house. If you are ready to elevate the visual quality of your campaigns and build content that genuinely stands out, we would love to talk about how we can support your next initiative.
Frequently asked questions
What is the most effective visual content type for B2B technology brands?
Short-form video leads overall ROI across most categories, but in B2B tech, long-form formats like product demos, webinars, and detailed case-study visuals build the deeper trust that drives high-value purchase decisions.
How do I measure the ROI of my visual content efforts?
Track engagement rates, conversion lifts, and influenced revenue for each content type, and use A/B testing to compare formats directly. Brands with strong visuals grow revenue 2.9x faster, which gives you a meaningful external benchmark to calibrate your internal performance targets against.
How can AI make visual content production easier?
AI tools can cut production time by up to 40% on tasks like image generation, background creation, and asset variation, but human creative oversight remains essential for maintaining brand consistency and visual quality.
Why do visual strategies drive more engagement?
Visual content earns 94% more views than text-only content, and posts with images on Facebook generate engagement rates that are 650% higher, because the human brain processes visual information faster and retains it longer than written words alone.